


Tableau Skill

Tableau is a powerful data visualization and business intelligence tool that allows users to connect, visualize, and share data in a way that provides insights and facilitates decision-making. Tableau can connect to a wide range of data sources, including databases, spreadsheets, cloud-based data, and more. Tableau has built-in tools for data cleaning, shaping, and transforming data before visualization. In Tableau, you work with sheets (where individual visualizations are created) and dashboards (where multiple visualizations are combined for a comprehensive view). Visualizations are created by dragging and dropping fields onto the Rows and Columns shelves. Marks represent individual data points, and filters allow you to focus on specific subsets of data. Tableau integrates with various data sources, including databases like MySQL, SQL Server, and cloud services such as Google BigQuery and Amazon Redshift.
Tableau Sub Skills
Loading Skills...
Loading...
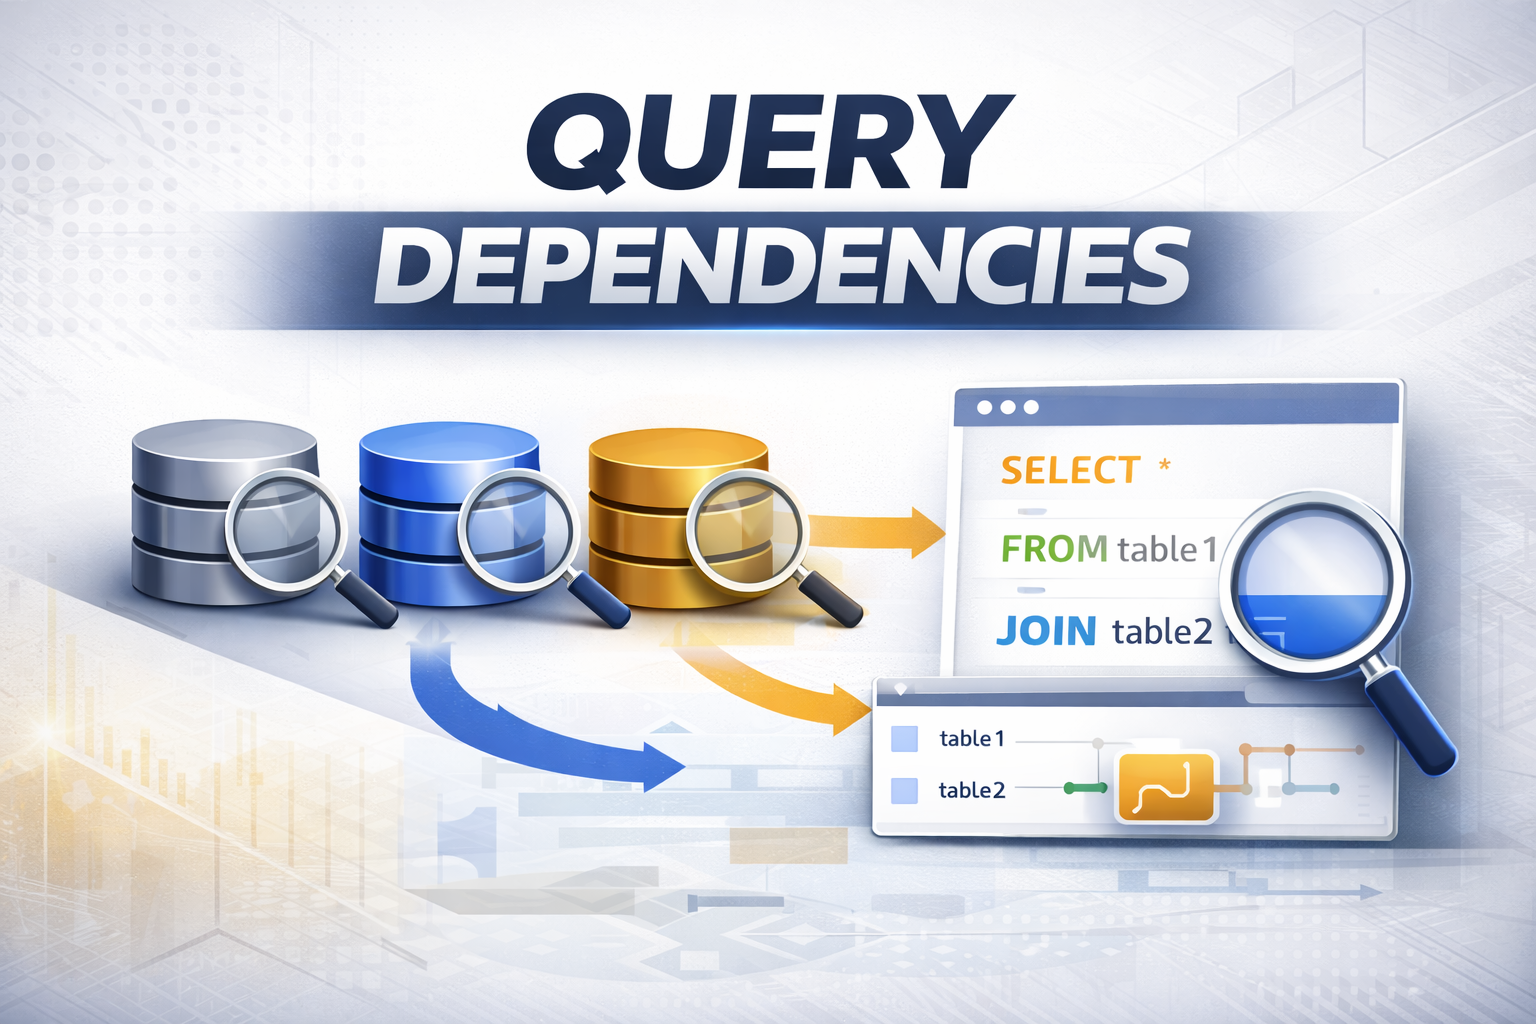
Query Dependencies in Power BI Explained
Data Science
Data Engineering: DWH and Big Data
Query Dependencies in Power BI: Understanding...

Power BI Introduction – Learn Data Visualization
Data Science
Data Engineering: DWH and Big Data
Power BI Introduction: Transforming Data Into...
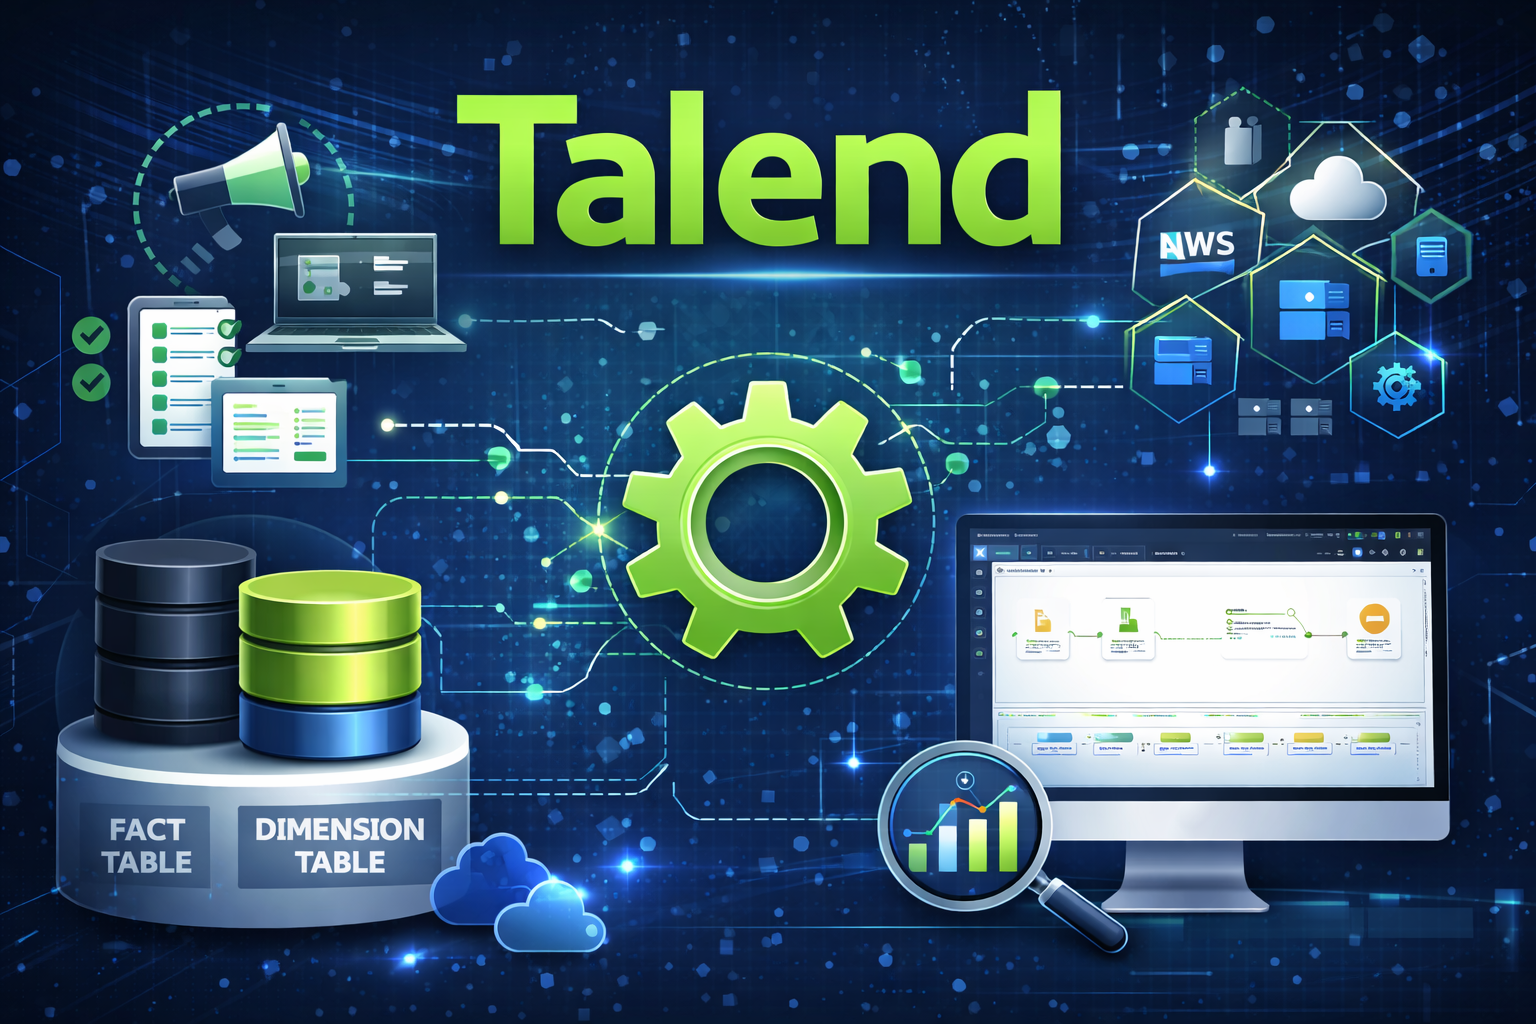
Talend ETL Introduction – Complete Guide for Beginners
Data Science
Data Engineering: DWH and Big Data
Talend ETL Introduction: The Visual Data...